


The operators quietly profiting in sneaker reselling right now share one trait: they stopped treating it like a lottery and started treating it like a portfolio. The market rewarded guesswork for years. It no longer does.
This article explains what the data now says about sneaker reselling, why the old playbook stopped working, and how serious operators use a portfolio-level view to protect profit in a maturing market. The Market Is Big, Real, and Less Forgiving
Over the past decade, sneaker reselling grew from parking-lot trades and forum meetups into a structured global industry with dedicated platforms, institutional-grade data, and professional operators. The numbers reflect that maturity.
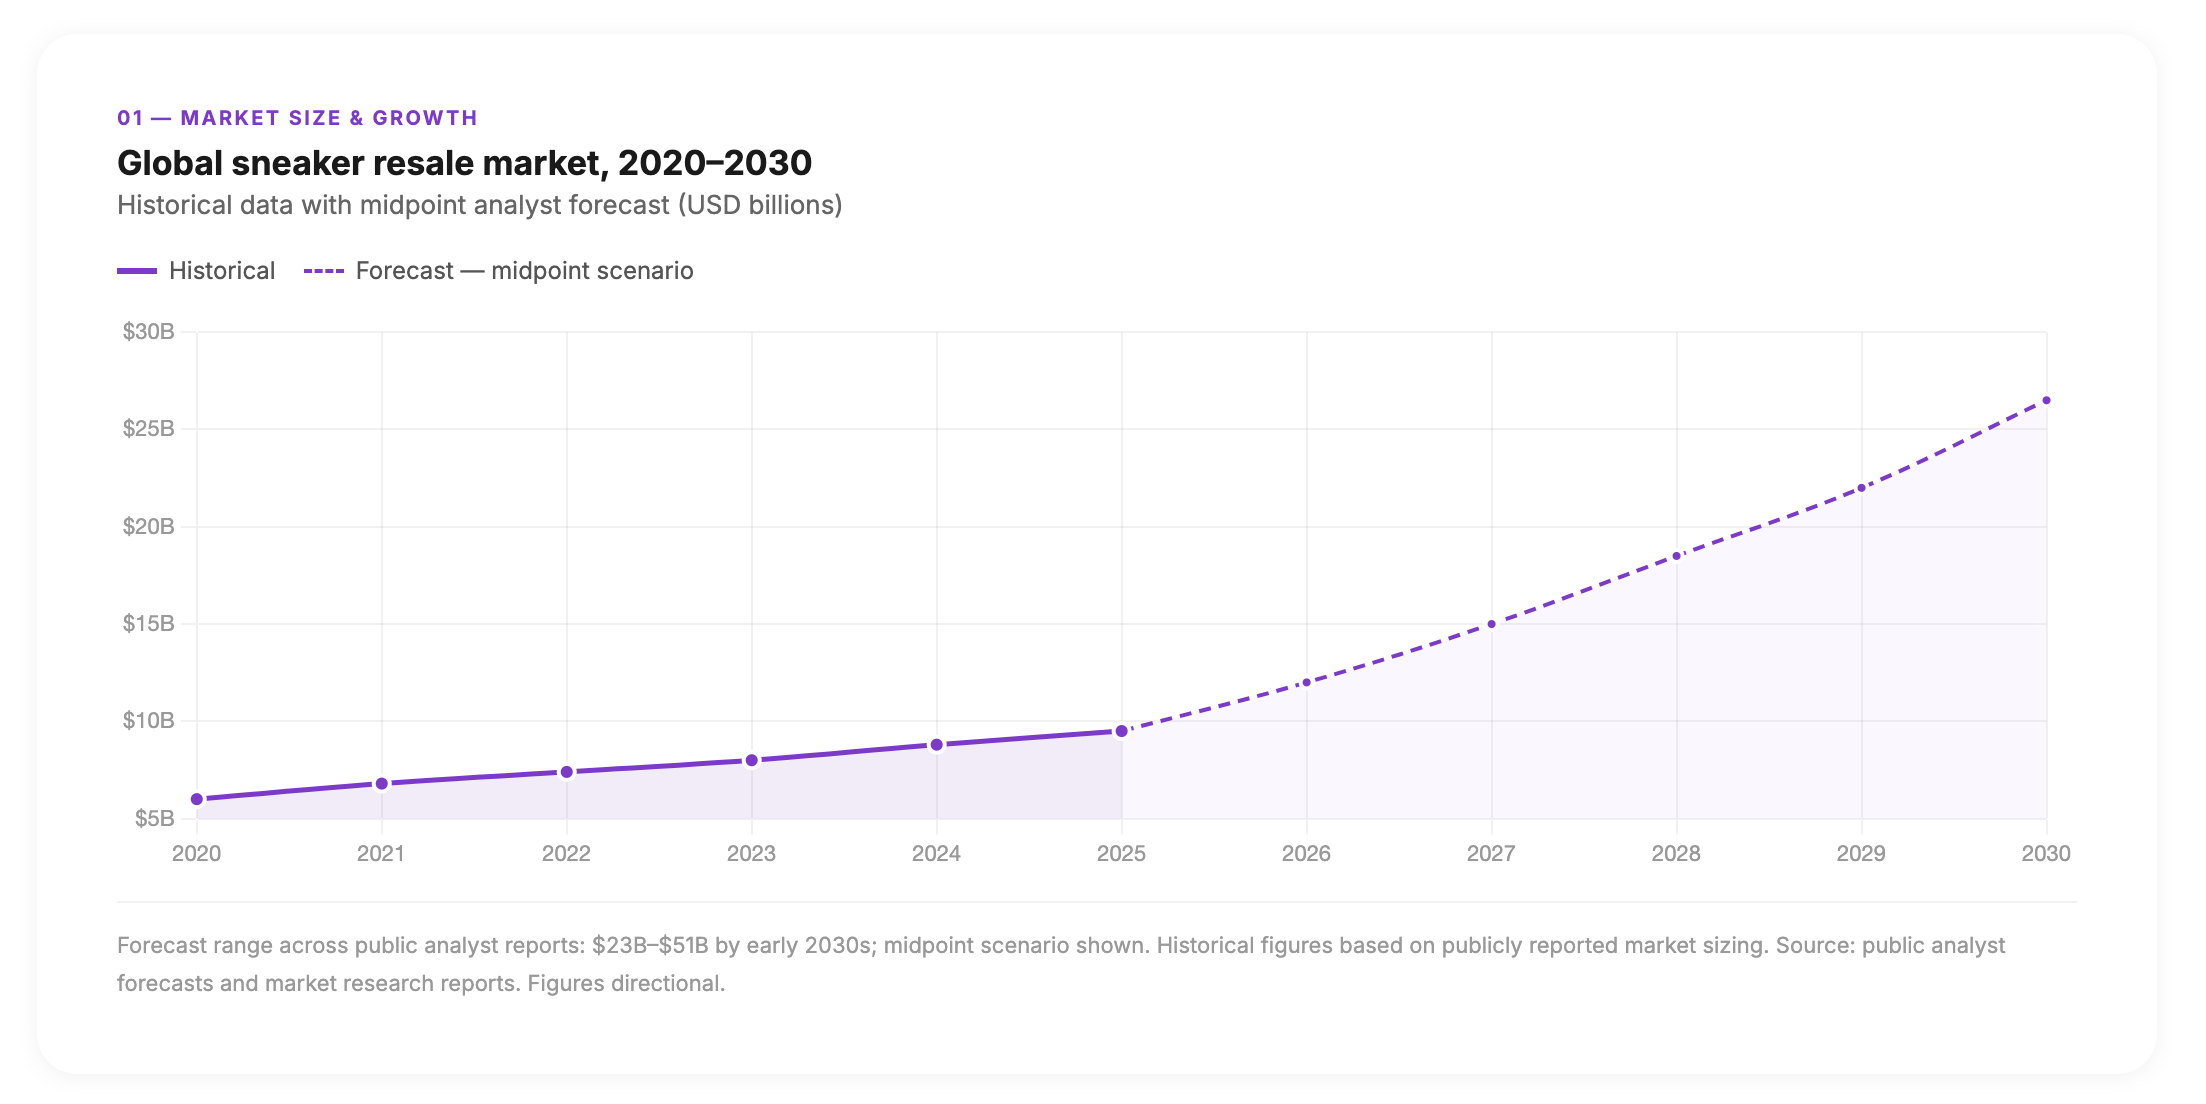
Recent analyses estimate the global sneaker resale market at roughly $8.5–$10.6 billion in the mid-2020s, with forecasts projecting figures between $23 billion and $51 billion by the early 2030s—implying high double-digit compound annual growth across most scenarios, even after the post-pandemic correction. For context, the broader sneaker market is projected to reach approximately $126 billion by 2033, meaning resale has become a structurally meaningful slice of a very large pie.
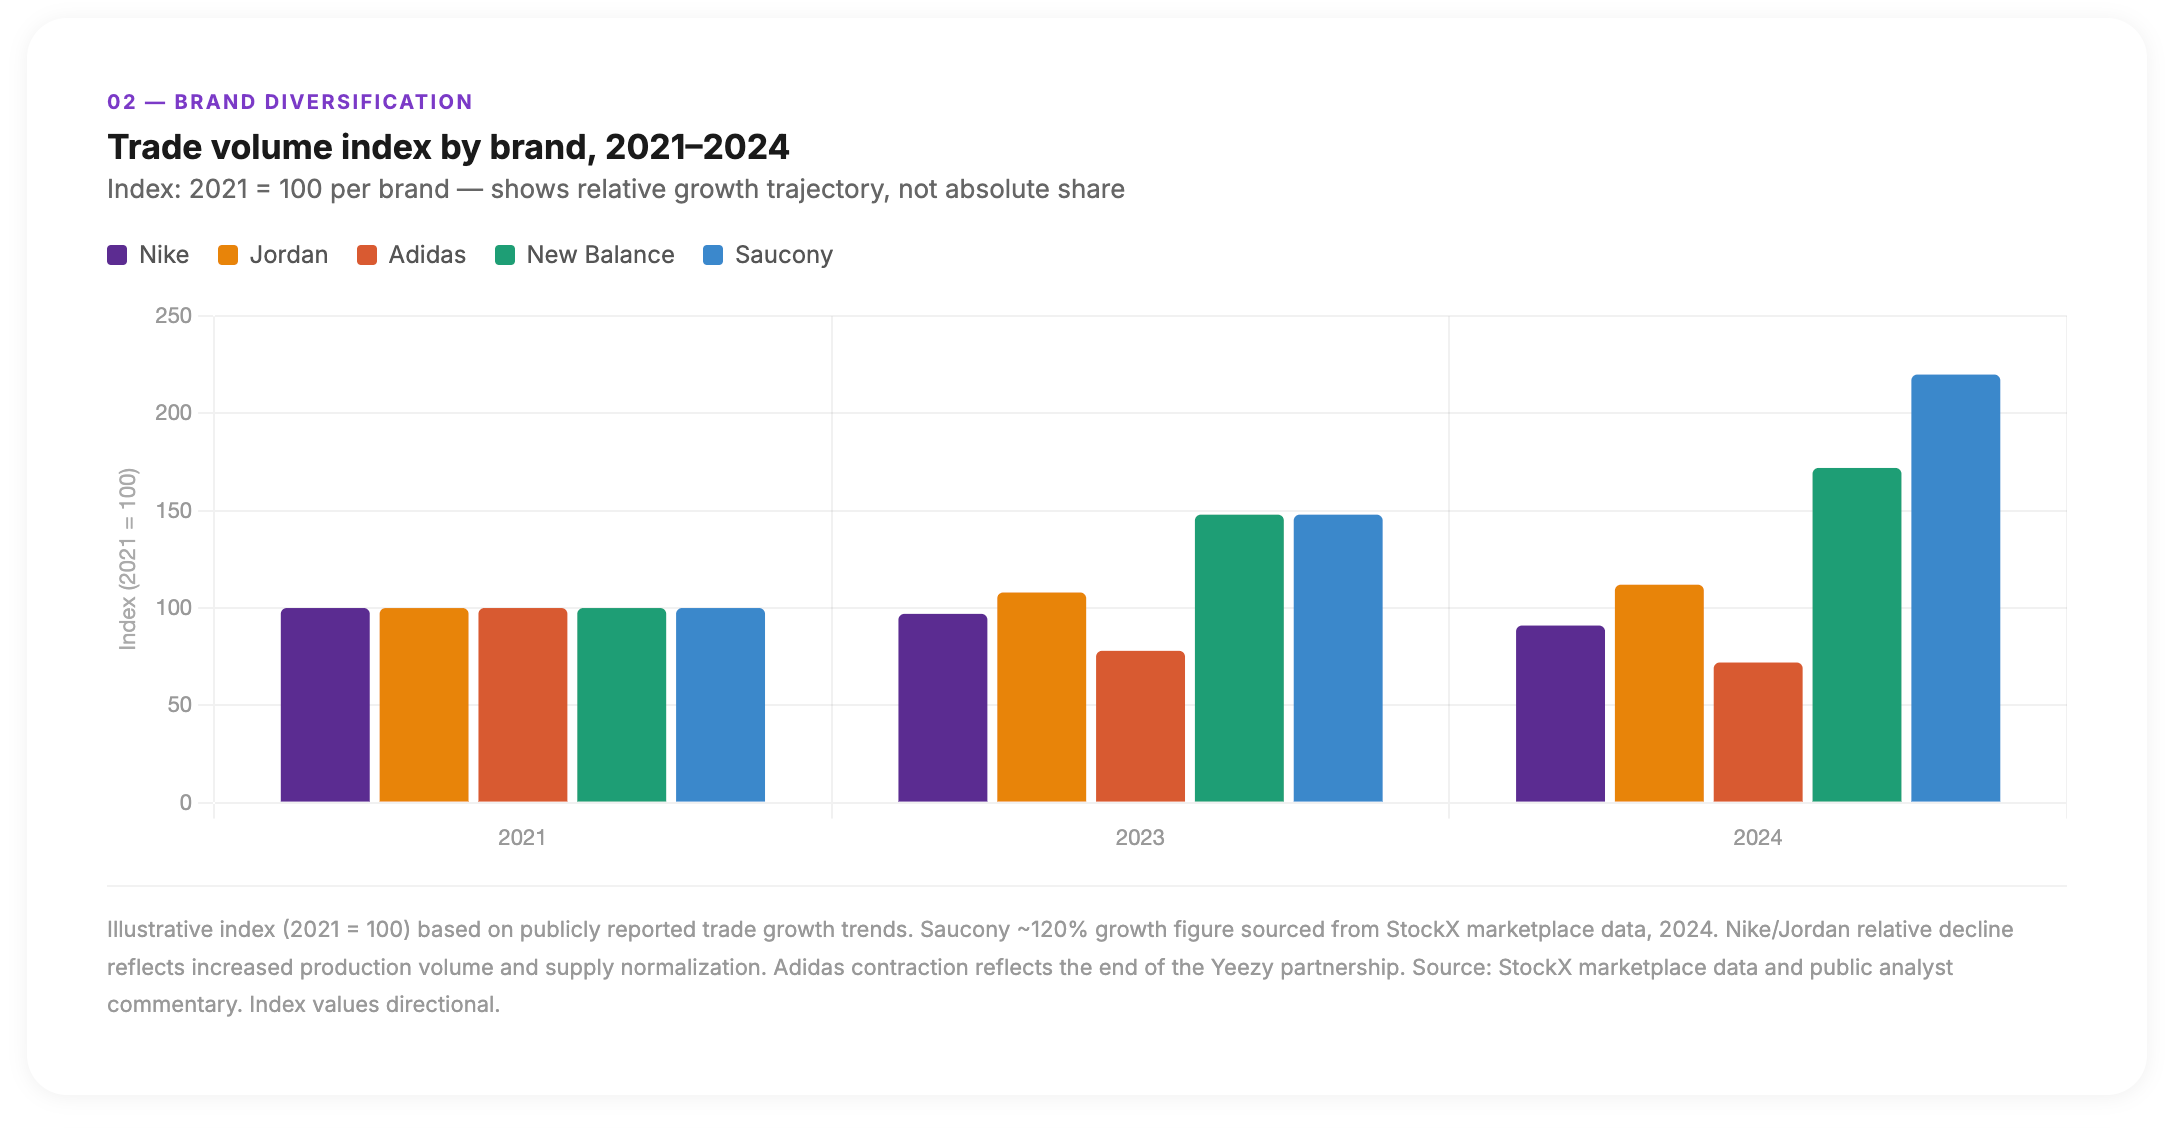
Under the hood, demand has also diversified. Data from StockX and other marketplace reports show that while Nike and Jordan still anchor resale volume, a growing long tail of brands—New Balance, Asics, Saucony, Mizuno, Anta—has posted triple-digit trade growth in recent years. Saucony, for example, reached approximately 120 percent growth in trades on StockX in 2024, driven by retro runners and niche collaborations. Resale demand is no longer confined to a handful of iconic silhouettes.
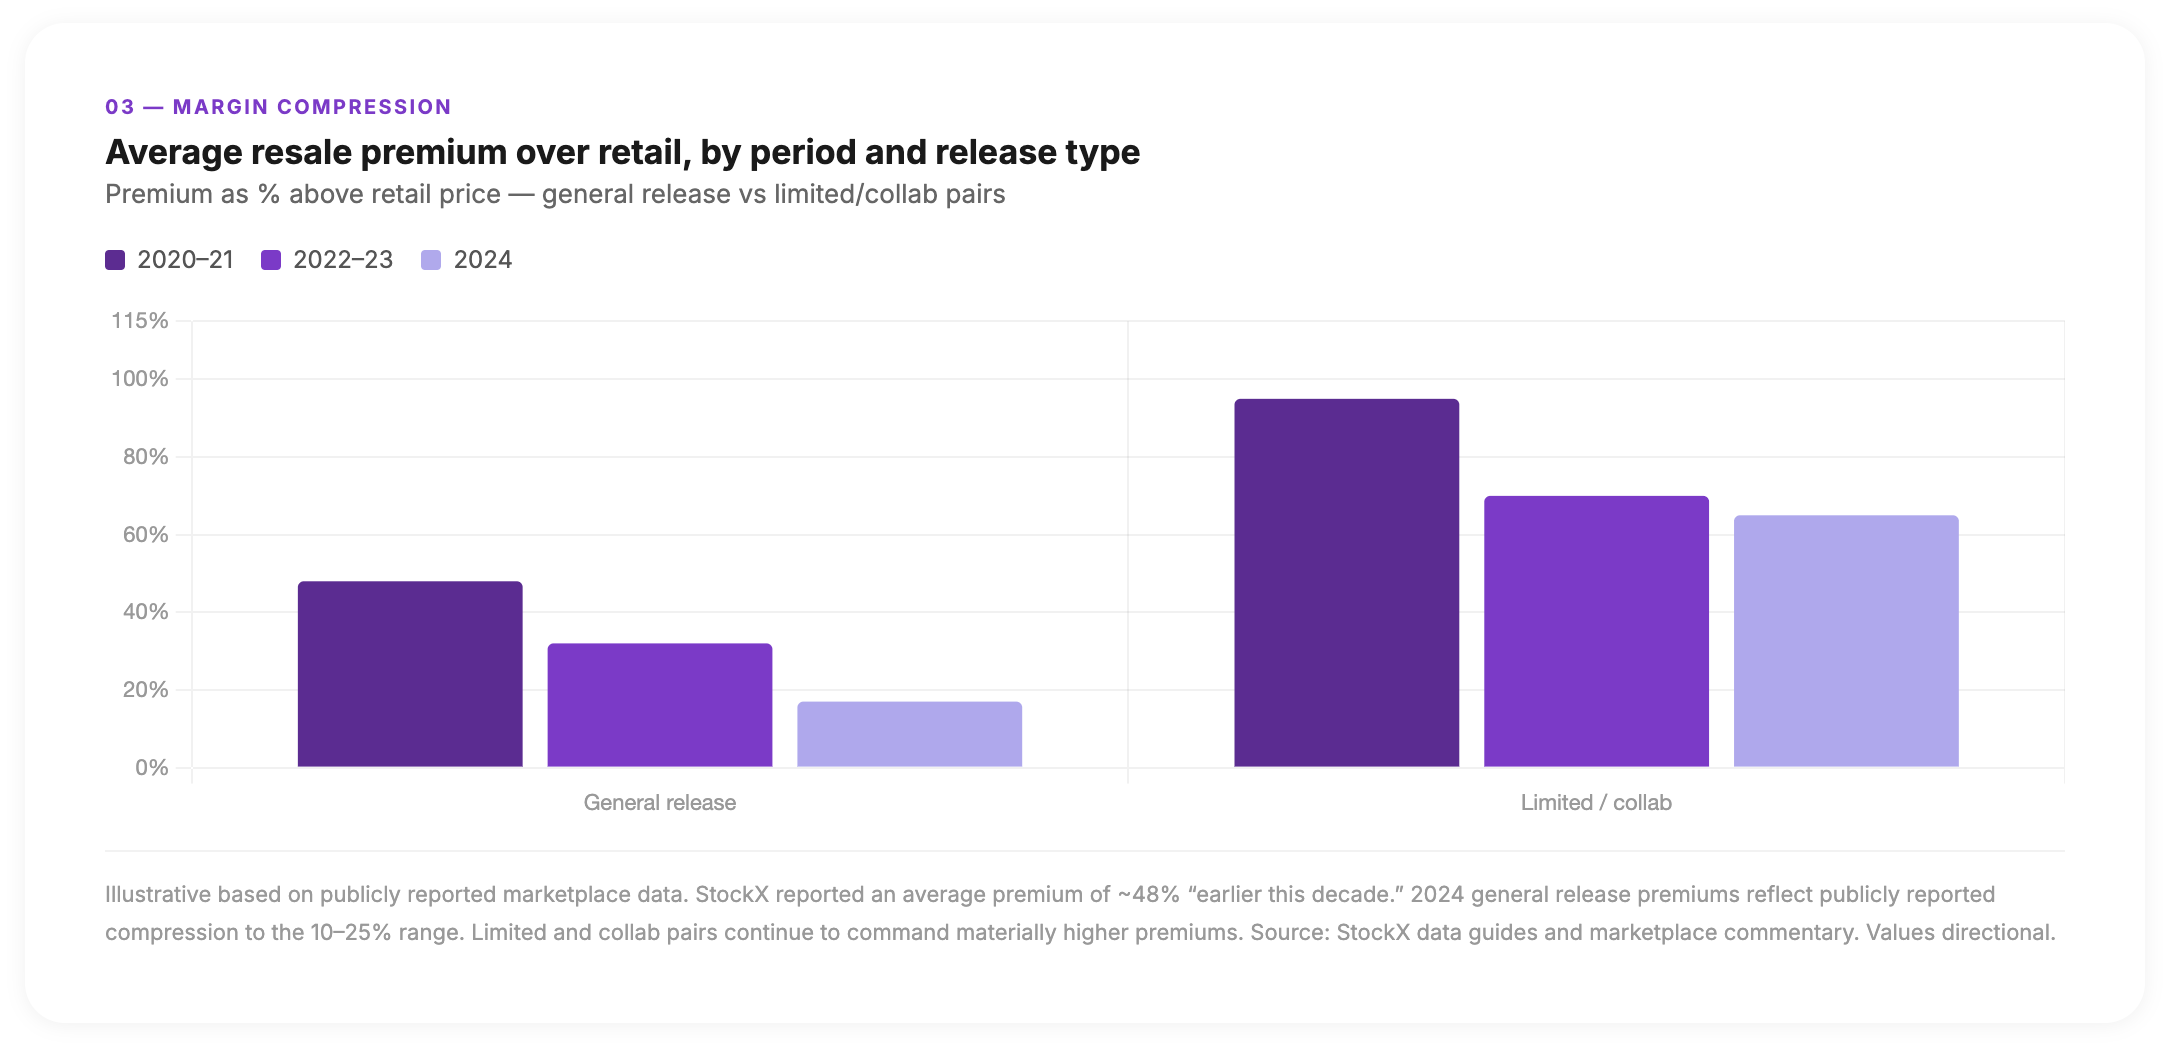
Yet the same data also shows clear signs of maturation. Marketplace reports and secondary analyses point to a shift from a relatively high-premium environment at the start of the decade to a more competitive landscape where easy markups have largely disappeared. A 2025 market analysis notes that while the global sneaker resale segment is projected to grow significantly through 2030, average margins on many releases have compressed from triple-digit levels to a range closer to 10–25 percent. The market is still expanding—but capital discipline now matters far more than it did when nearly anything with a swoosh could be flipped for a quick premium.
Why the Easy Money Disappeared
Understanding how margins shrank is necessary context for how to use data effectively today. Several structural shifts appear consistently across marketplace reports and commentary.
Oversupply and the end of manufactured scarcity. Analysts tracking Nike's production strategy point to a deliberate increase in output for historically limited silhouettes—including the Dunk and Air Jordan 1—beginning in late 2023 and continuing through 2024. Pairs that once sold out immediately became accessible at retail, flipping the supply-demand balance and compressing premiums. Across the broader market, the number of "special" releases has grown faster than demand. Even when platforms report record sales across nearly 200 brands, the abundance of options means fewer individual shoes can sustain outsized premiums for long.
A more rational buyer. Consumer behavior shifted after the 2020–2021 boom. During that period, buyers regularly paid double retail for popular pairs. An NPR segment on the resale market highlighted how models like the "Lost and Found" Air Jordan 1—which retailed at approximately $180—could resell for $500–$600 at peak demand. That type of markup is now rare outside of truly exceptional releases. Analysts and reporters consistently note that buyers have grown more price-sensitive and less willing to chase every drop at any cost. Average premiums on mainstream platforms reflect this: a StockX data guide from earlier in the decade reported an average retail premium of approximately 48 percent; more recent commentary suggests the typical spread on general releases has moved closer to low double digits, even as a subset of pairs still commands higher multiples.
Professionalization of the seller side. What was once the domain of a small number of plugged-in enthusiasts is now accessible to anyone with internet access. Guides, Discord groups, cook groups, and analytics tools have made release calendars, early links, and pricing tactics widely available. This democratization is good for market liquidity but bad for pure arbitrage. With more sellers pursuing the same drops armed with similar information, the window for easy flips on mainstream pairs narrowed sharply. Resellers who still generate meaningful profit today tend to exhibit three traits highlighted in market analyses: they treat reselling as a real business, they embrace volume, and they use data to allocate capital.
What the Data Really Needs to Show Now
In this environment, the relevant question is no longer whether sneakers can be resold at a profit. It is what information actually protects profit across a portfolio. Data is abundant but not always decision-ready. Three categories stand out.
True Profit After All Costs
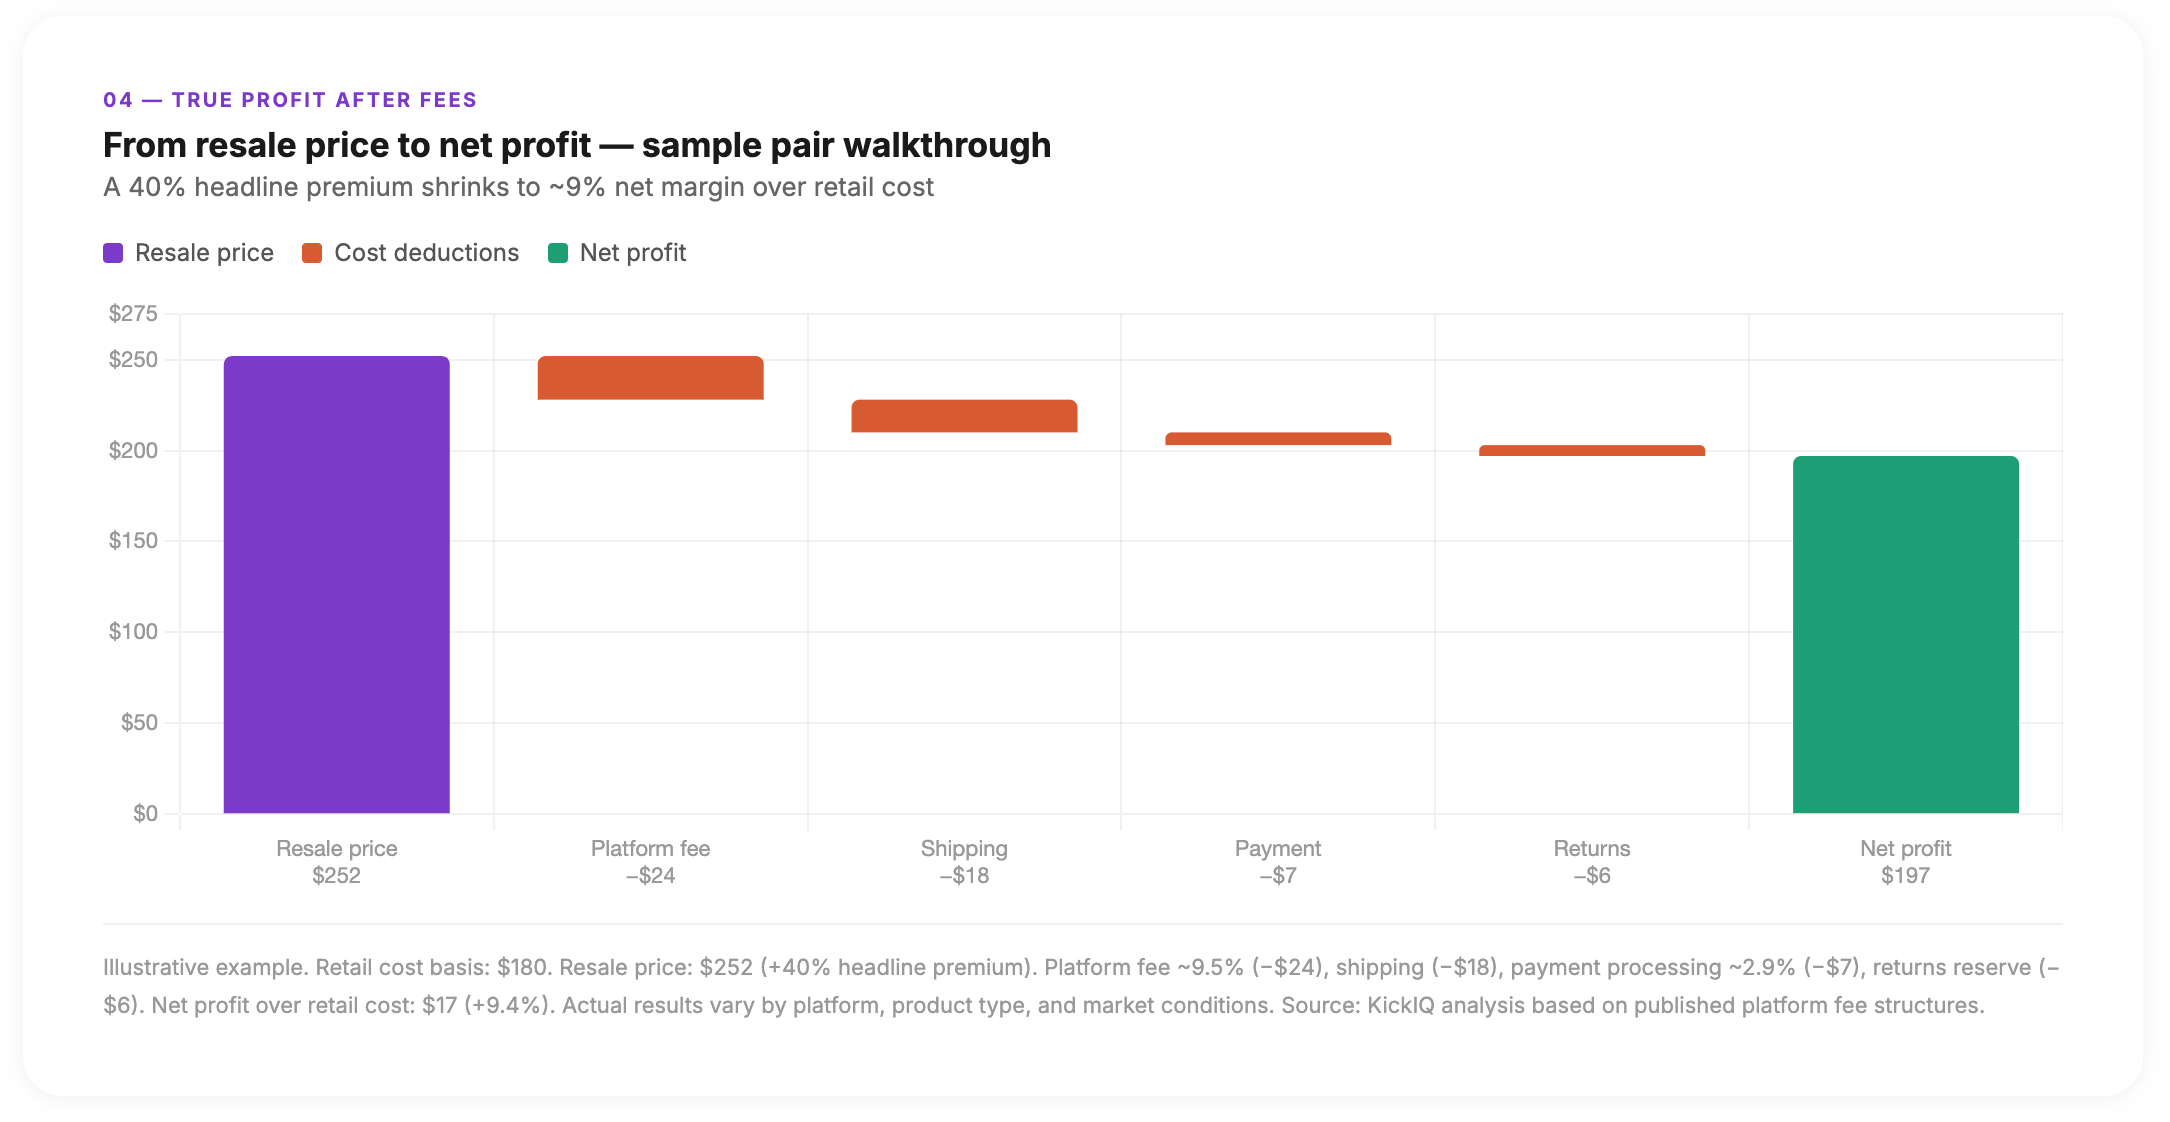
Most public statistics focus on resale price premiums—how much higher the resale price is relative to retail. While useful for tracking market heat, this metric obscures what matters to operators: true profit after platform fees, shipping, taxes, payment processing, and returns.
Platform fees vary by marketplace and product category. Shipping costs fluctuate by carrier, region, and service level. Taxes and payment processing take additional cuts. Without a unified view that pulls all of these into a single per-pair profit figure, resellers routinely overestimate performance.
A pair delivering an apparent 30 percent premium over retail may shrink to single-digit net margin once the full cost stack is applied. Conversely, a pair with a modest headline premium on a lower-fee marketplace may quietly outperform. The only way to see this clearly is to track all costs at the order level across platforms and aggregate them into per-SKU and per-category profit views.
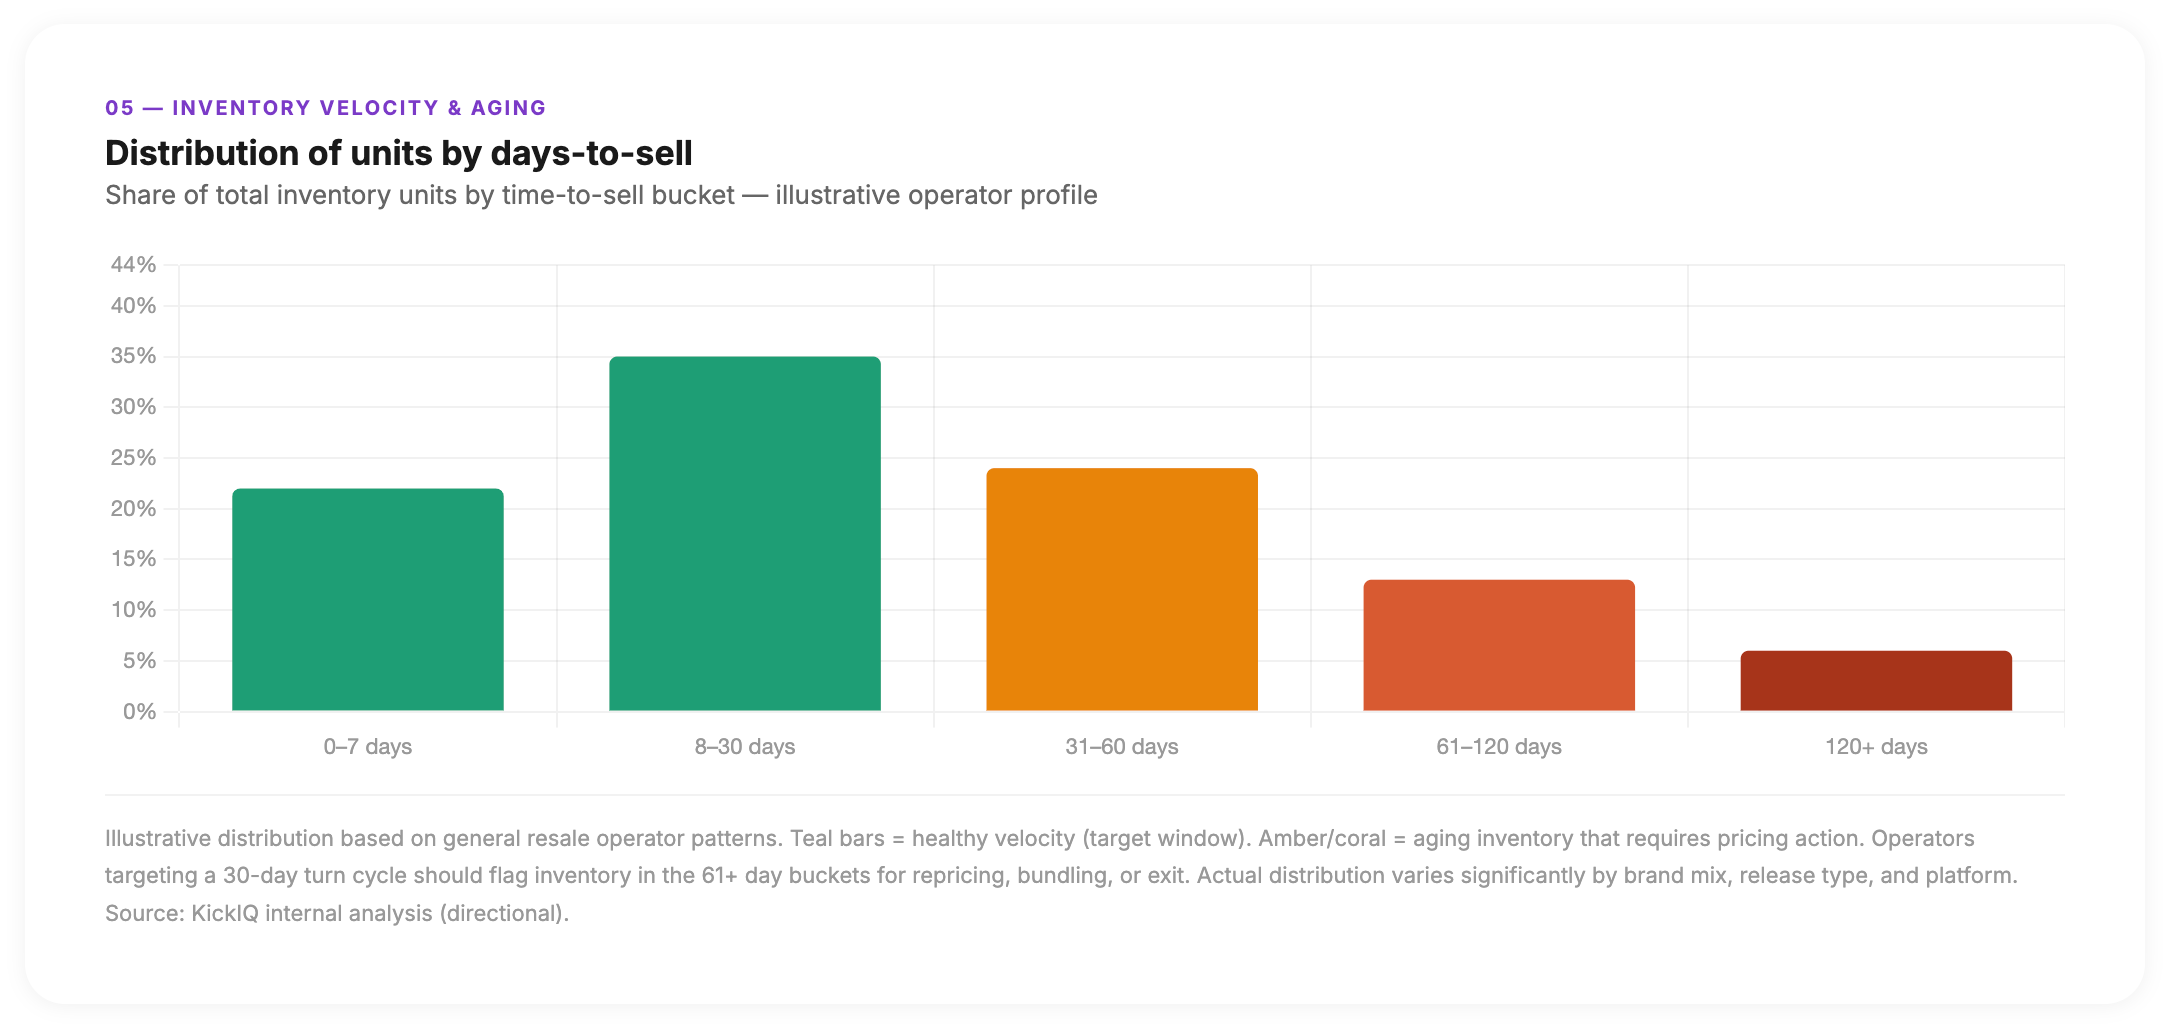
Velocity and Aging Inventory
Margin on paper means little if capital is locked in inventory that does not move. Multiple market reports note that overproduction and declining premiums have led to stagnating inventory for operators buying without clear sell-through conviction.
Practical operators need to track:
- How long a given SKU takes to sell on each platform, on average.
- How that time frame compares to the window in which a realistic premium exists.
- How much capital is tied up in items aging beyond the target threshold.
Tracking "days in inventory" and "time to sell" alongside per-pair profit reveals which SKUs are quietly draining capital even when they appear profitable in isolation. A lower-margin, fast-moving SKU often contributes more to monthly cash flow than a higher-margin pair that sits for months waiting for the right buyer.
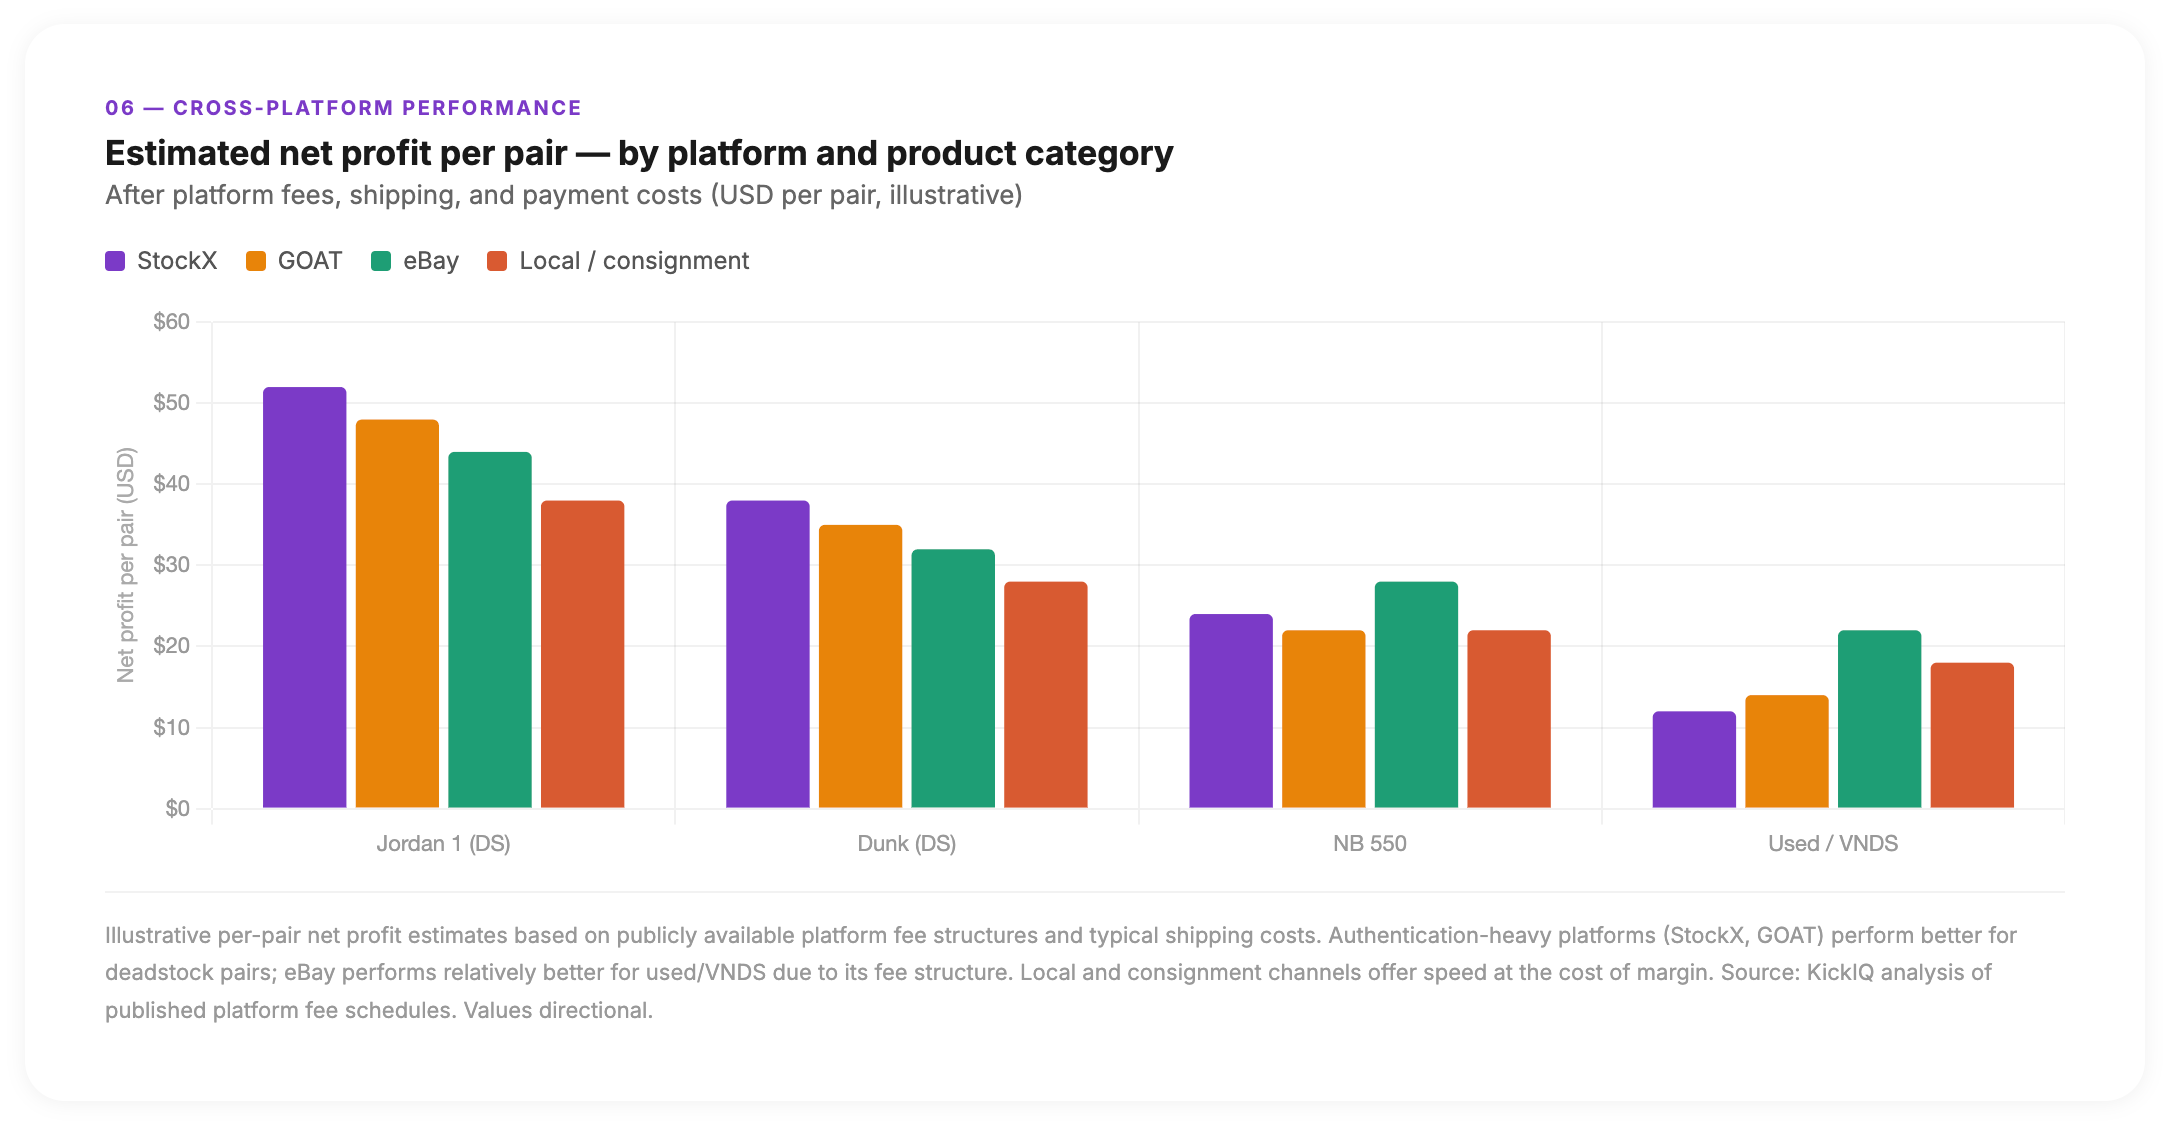
Cross-Platform Performance and Concentration Risk
The third category is platform-level performance and concentration. Data from StockX and other marketplaces illustrates both the concentration in Nike/Jordan and the growing share of smaller brands—but at the portfolio level, the question is more specific: where does each SKU actually perform best?
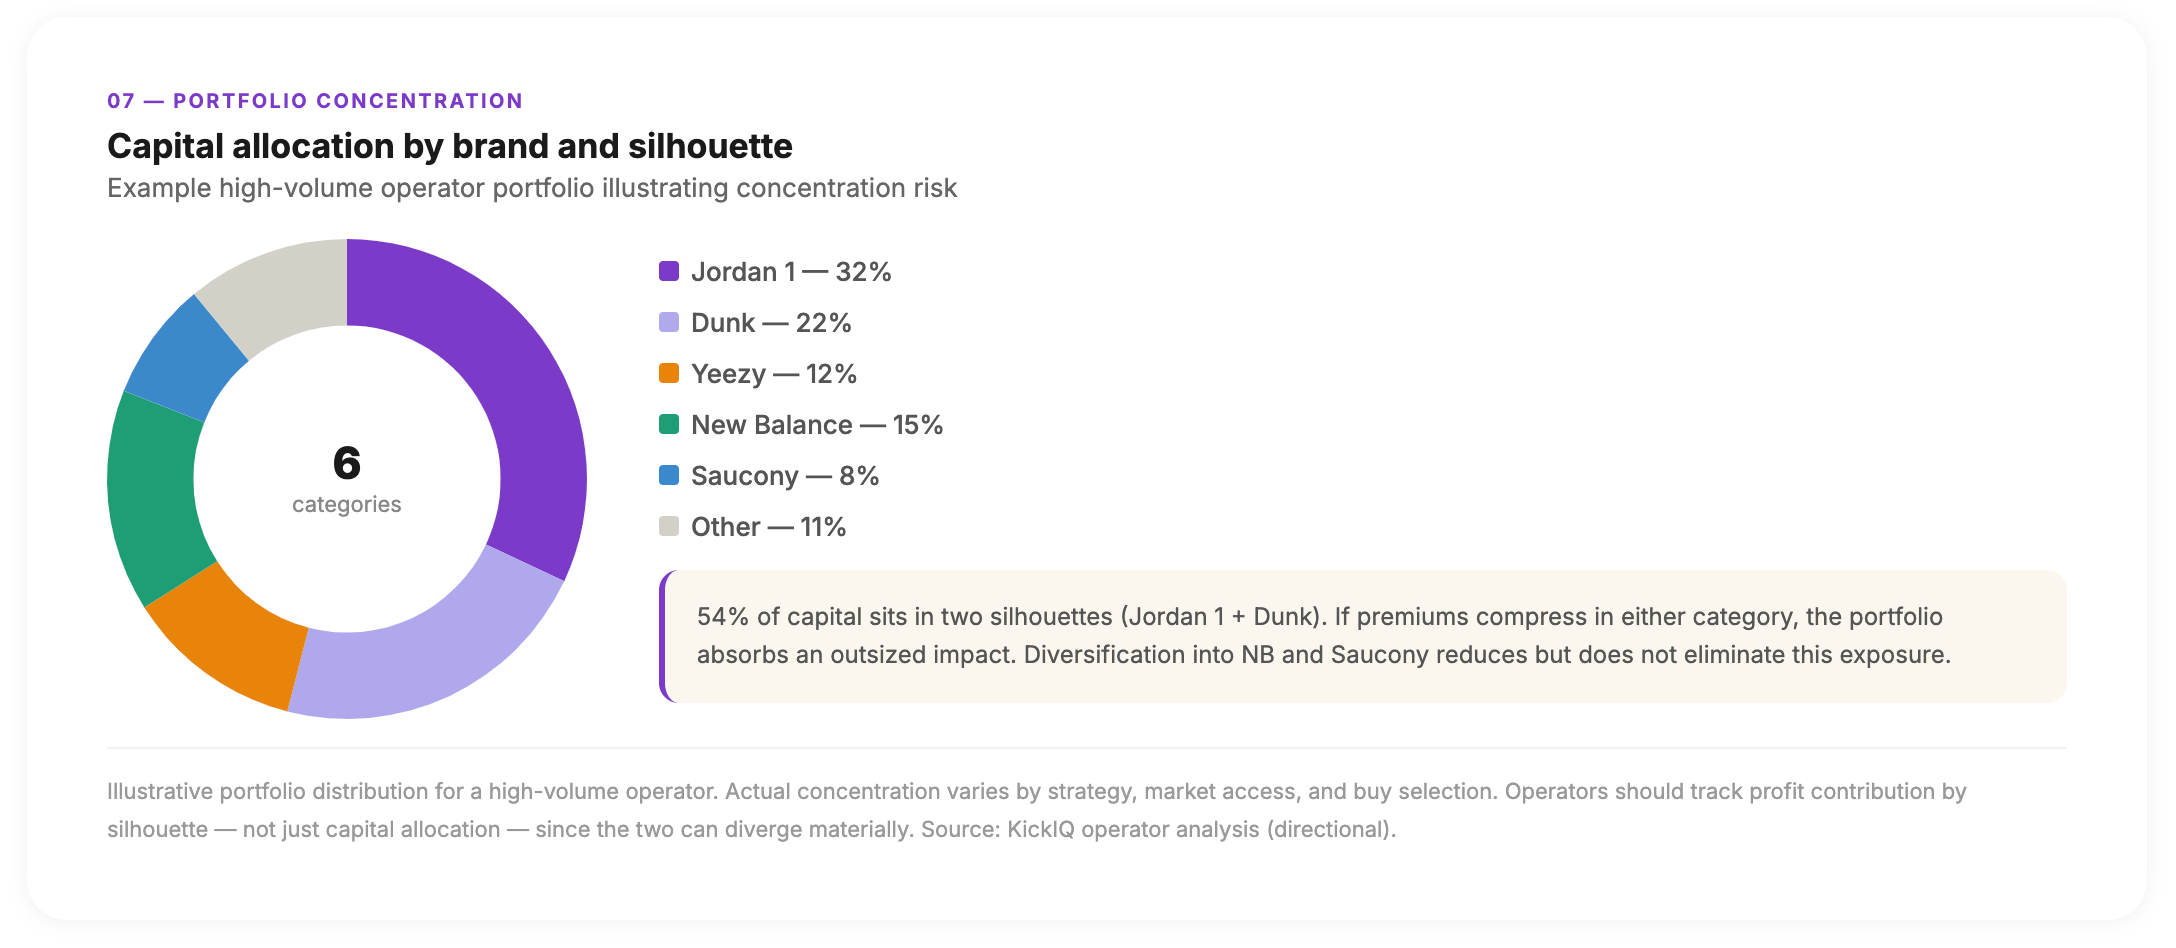
Key portfolio questions include:
- Are profits concentrated in a single brand or silhouette that is losing heat?
- Do certain marketplaces consistently deliver higher net profit for specific categories or conditions?
- Are there SKU-platform combinations where the same product underperforms relative to a clear alternative?
Some analyses highlight that pristine pairs command strong premiums on authentication-heavy platforms like StockX and GOAT, while used or imperfect pairs may perform better in community-oriented marketplaces or local channels. Without disaggregated performance data by platform, condition, and SKU, it is easy to keep sending inventory to the wrong venue—and attribute underperformance to the product rather than the channel.
From Sneaker Bets to Portfolio Decisions
At this point, the sneaker resale market behaves more like a large, volatile inventory portfolio than a string of independent bets. The data supports several practical shifts in how serious operators approach the business.
Treat each SKU as a position with a thesis. In a market where average premiums have compressed and overproduction is common, holding inventory without a clear conviction is expensive. A useful mental model:
- Entry: Why this pair, at this price, on this date—given current demand signals and production context.
- Time frame: Over what horizon is a premium realistic, and what aging threshold triggers action.
- Exit: Where and how profit will be realized—platform, price band, condition tier.
The operational layer is a system that flags when those conditions are no longer met. If a pair has not sold within the target window, or if marketplace data shows that premiums have materially compressed, the system surfaces it as a candidate for discounting, bundling, or avoidance on the next buy.
Use data to define where not to play. The most actionable statistics in market reports are sometimes the negative space. When analysts highlight triple-digit trade growth for brands like Saucony and Anta, they also implicitly highlight where growth is no longer explosive. Coverage of Nike and Jordan shows enduring volume alongside clear signs of fatigue and premium compression.
Resellers can operationalize this by maintaining explicit "no-buy" and "no-restock" criteria:
- Brands, silhouettes, or collabs whose premiums have structurally collapsed.
- Sizes or specific SKUs with chronically slow velocity relative to portfolio targets.
- Platform-category combinations where fees and return rates consistently destroy margin.
This negative map is as strategically important as any "hot list." It keeps capital from being deployed where the market has already moved on.
Move from static dashboards to live profit signals. Traditional tools often stop at retrospective dashboards—charts showing total sales, revenue by brand, or average premium over time. These support periodic reviews but are less useful for daily decisions. The shift that matters now is toward live, contextual signals: alerts when a SKU's net profit after all costs falls below a threshold on a specific marketplace; notifications when inventory ages beyond a target window with suggested discount ranges; flags when the same product shows a meaningful performance gap between two platforms.
Earlier marketplace data guides show how factors like brand, model, colorway, and collaboration status affect average premium. The next layer applies that pattern recognition to an operator's own store data and converts it into live, actionable decisions rather than historical observations.
What a Modern Sneaker Data Stack Requires
Given this landscape, a modern sneaker reselling data stack needs to deliver five things:
- Unified order and cost data across all platforms—including every fee, shipping cost, tax, discount, and return—so that true net profit is visible at the order, SKU, and category level at all times.
- Inventory aging and velocity tracking that ties days in inventory and time to sell to clear action thresholds for discounting, bundling, or avoiding similar pairs in future buys.
- Cross-platform performance views showing where each SKU, category, and condition performs best—and where performance is deteriorating relative to alternatives.
- Brand and silhouette trend context informed by external market signals—such as shifts in trade volume or premium levels for key brands—to frame an operator's own numbers against broader market movement.
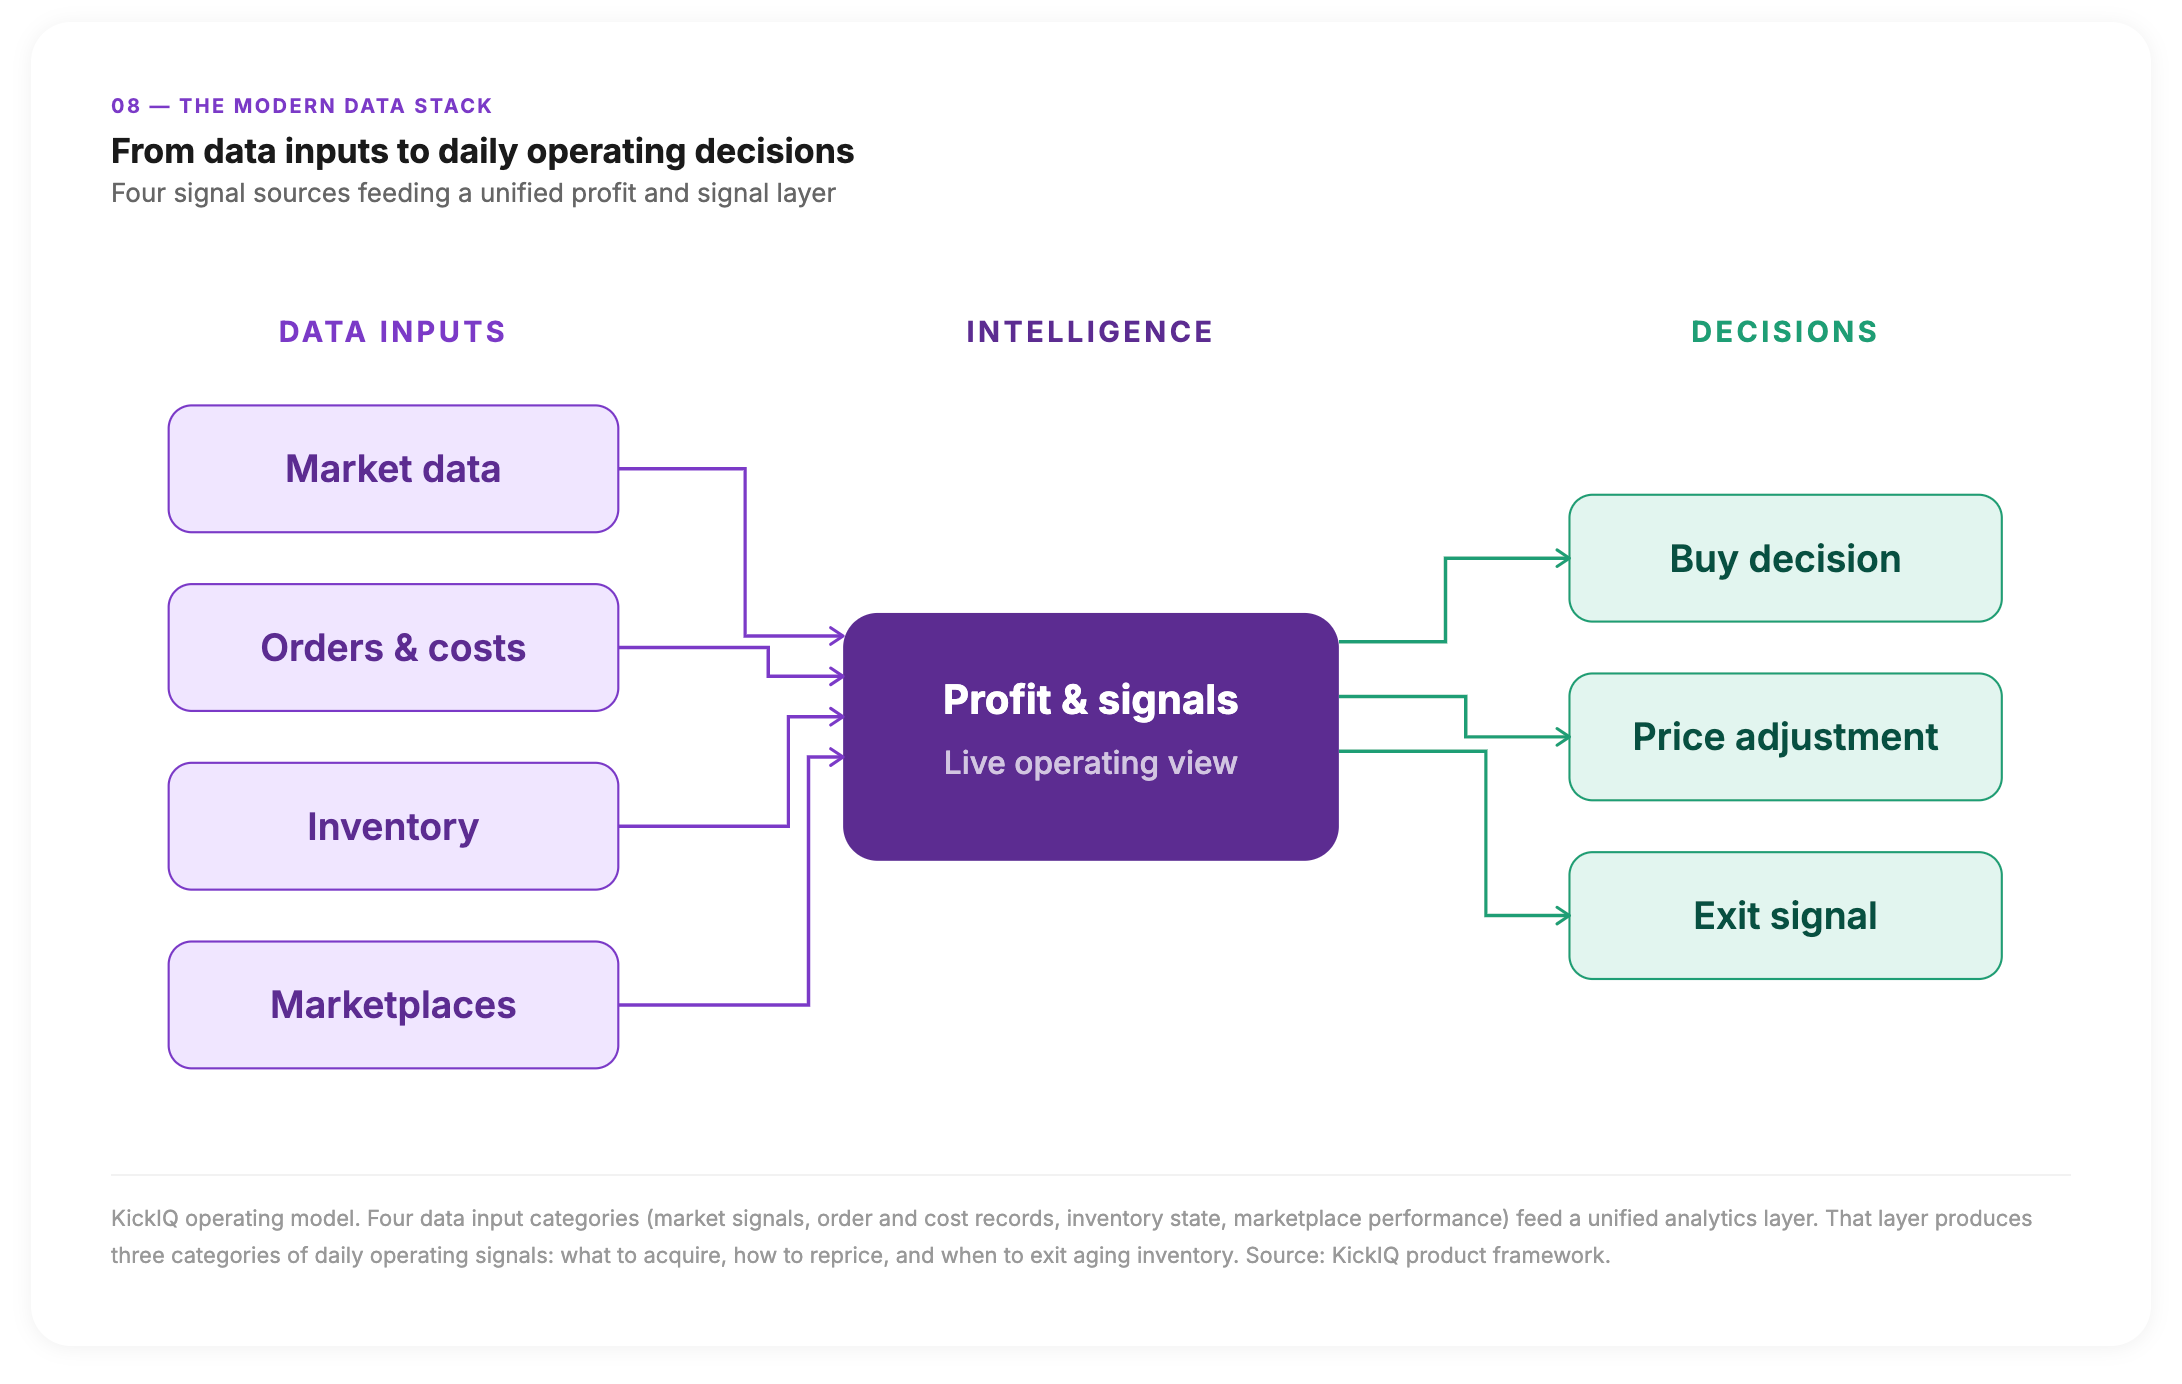
- Live signals and review routines that turn all of the above into daily habits: brief morning reviews, weekly portfolio rebalances, monthly expansion assessments—rather than occasional deep dives after problems surface.
[Image / diagram: Systems diagram — "The Modern Sneaker Data Stack." Four input nodes feeding a central processing layer: "Market data" (external signals, brand trends, platform premiums), "Orders & costs" (fees, shipping, taxes, returns), "Inventory" (SKUs, age, condition), "Marketplaces" (platform-specific performance). These feed into a central hub labeled "Profit & signals." Output arrows from the hub point to three decision categories: "Buy," "Price," and "Exit." Clean, minimal, operator-focused aesthetic—not a traditional chart.]
The Next Phase Belongs to Operators Who See Clearly
The sneaker resale market is still expanding. Forecasts project the secondary sneaker segment growing from its current base to the mid-teens of billions by the early 2030s—meaningful growth, even in a maturing market.
But participating in that growth now requires something different than it did in 2020. The easy premium is largely gone. Supply has caught up. Buyers are disciplined. The seller base is large and well-informed.
What separates operators who grow from those who grind and stall is not access to the next heat drop. It is a clearer, faster view of what is actually happening inside their own business—per pair, per platform, per day. That clarity, applied consistently, is what turns a reselling operation into a real business.
The market still rewards those who see what others miss. In the next phase, what matters most is seeing the truth in one's own data while others are still relying on feel.
KickIQ is a Sneaker Intelligence platform built for sneaker resellers. This article reflects publicly available market data and editorial analysis. Individual results vary based on inventory, platform mix, and execution.
Found this valuable?
Share it with your network